With an MSc in International Relations and Educational Technology, I bring a unique perspective to business intelligence that combines analytical rigor with strategic thinking. Based in Oslo, I specialize in building enterprise-grade compliance systems and transforming complex financial data into actionable insights that drive strategic business decisions. My cross-cultural experience across Ghana, China, and Norway enables me to work effectively with diverse teams and understand global market dynamics.
Built a full-stack sales platform using React, Node.js, and PostgreSQL to manage customer lifecycles and license forecasting.
Implemented AI-ready win-rate analysis and smart segmentation by industry, region, and company size. Business Impact: Streamlined sales processes with timeline views, renewal tracking, and interactive dashboards.
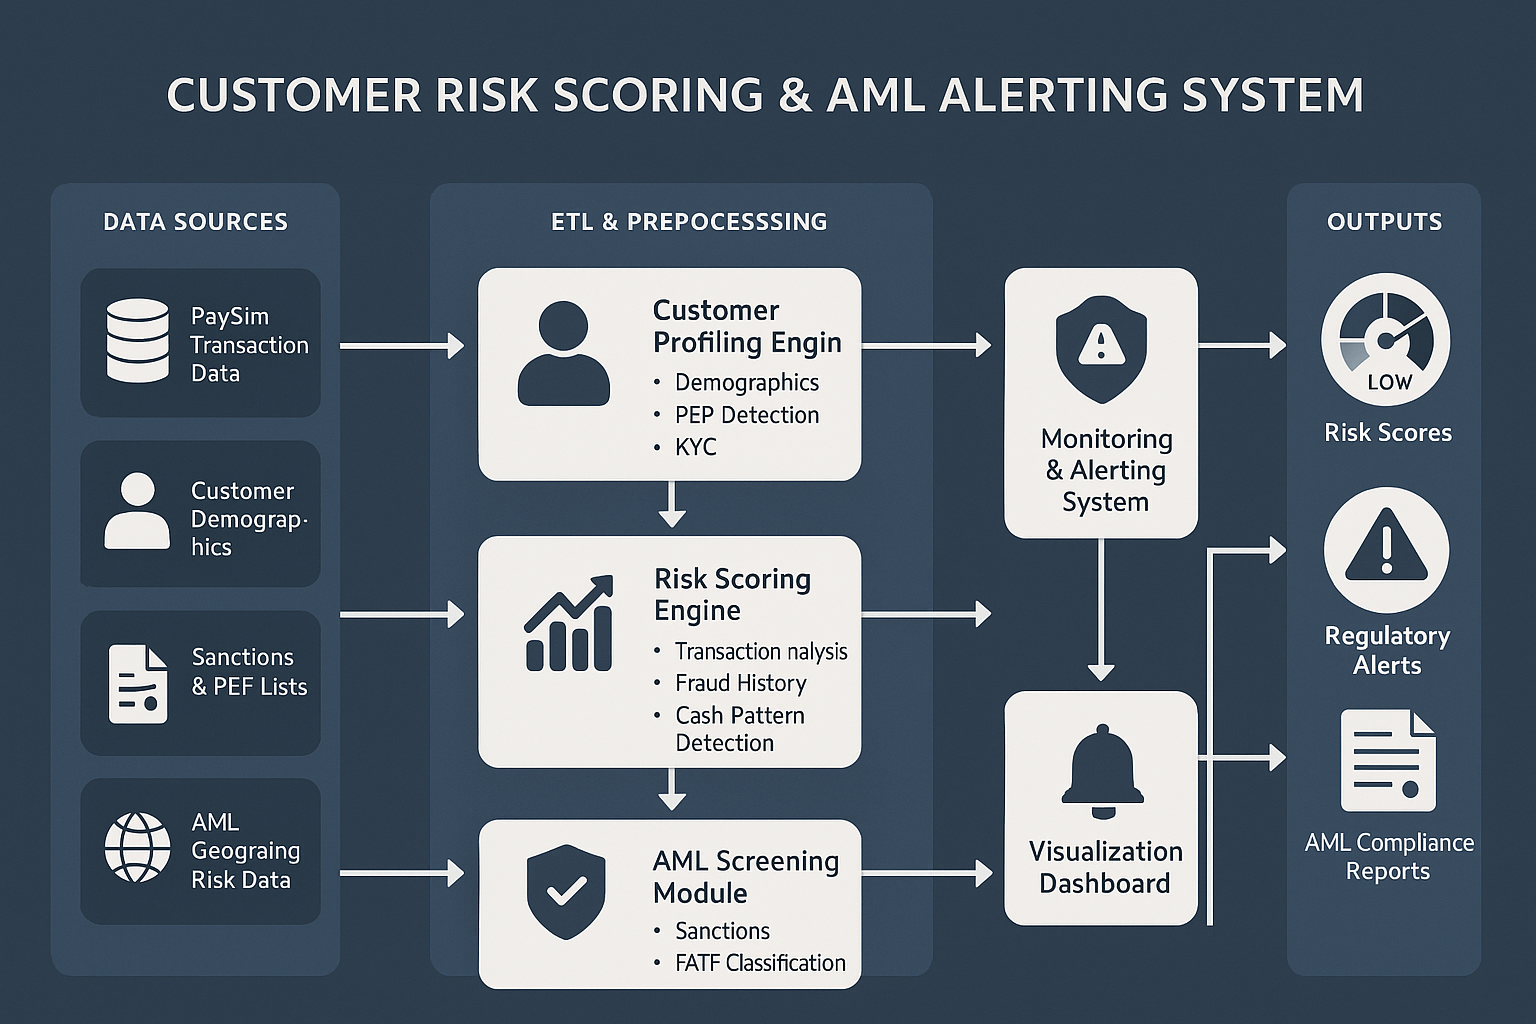
Professional-grade risk assessment system combining transaction analysis, customer profiling, and AML compliance.
Implemented Python-based scoring algorithms with PEP detection, sanctions screening, and geographic risk factors. Business Impact: Automated risk categorization for financial institutions with regulatory reporting capabilities.
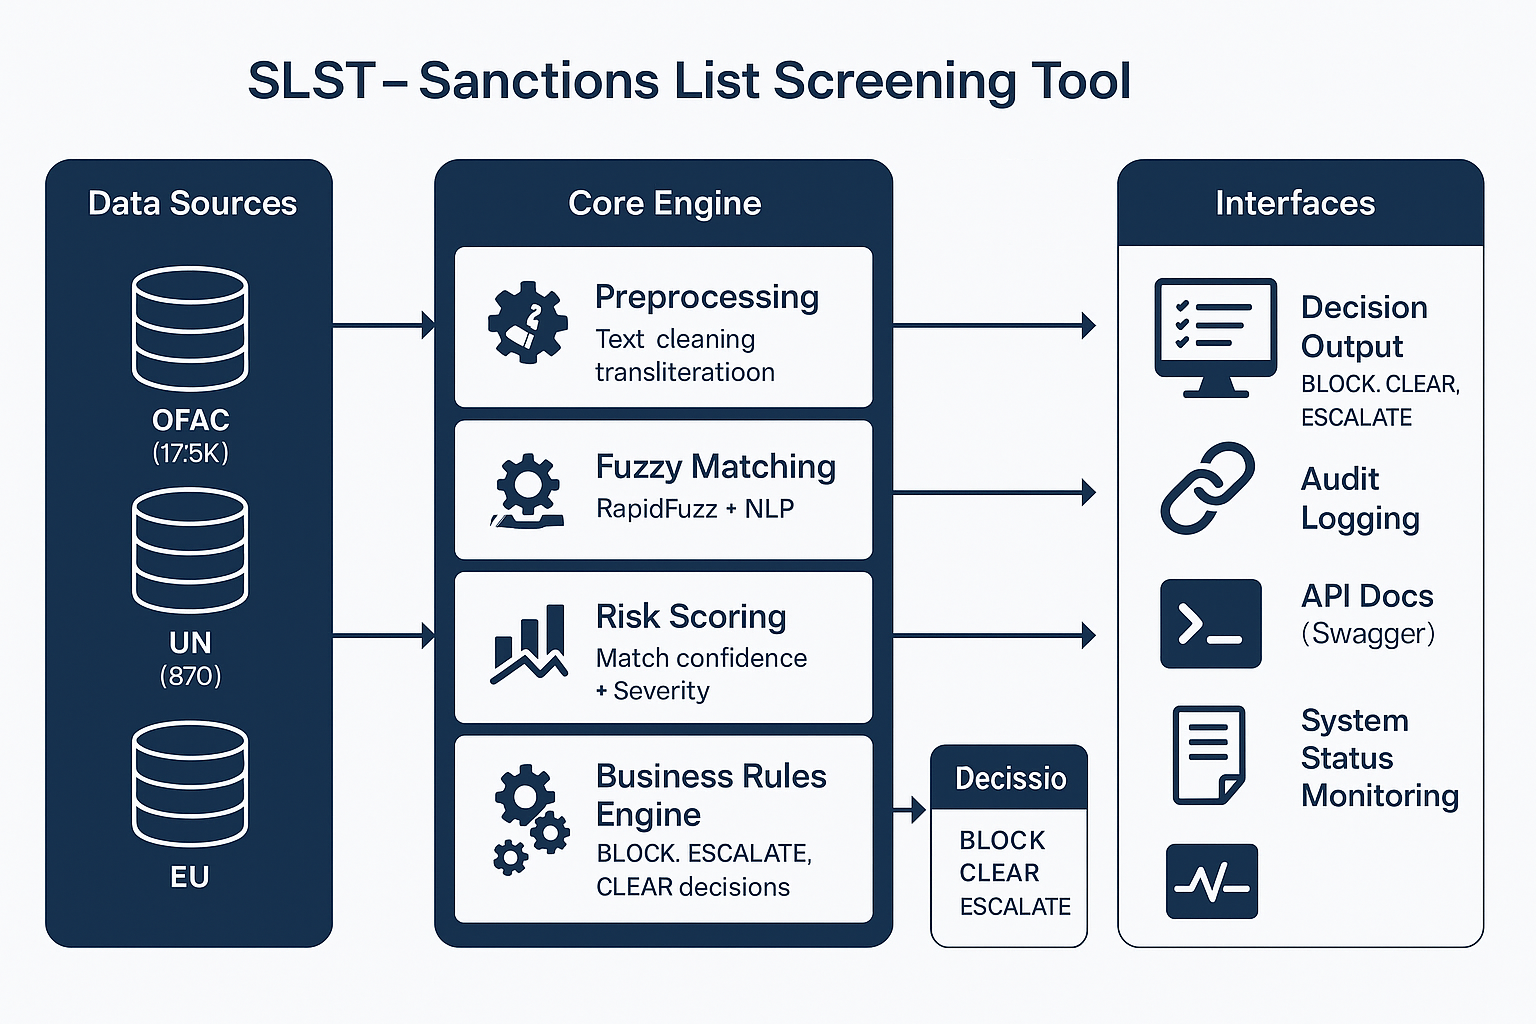
Production-grade compliance screening system processing 18,000+ sanctions entries from OFAC, UN, HMT, and EU sources.
Built with FastAPI and advanced NLP for sub-second screening with automated BLOCK/ESCALATE/CLEAR decisions. Business Impact: Delivers enterprise-grade performance with full audit trails and regulatory reporting capabilities.
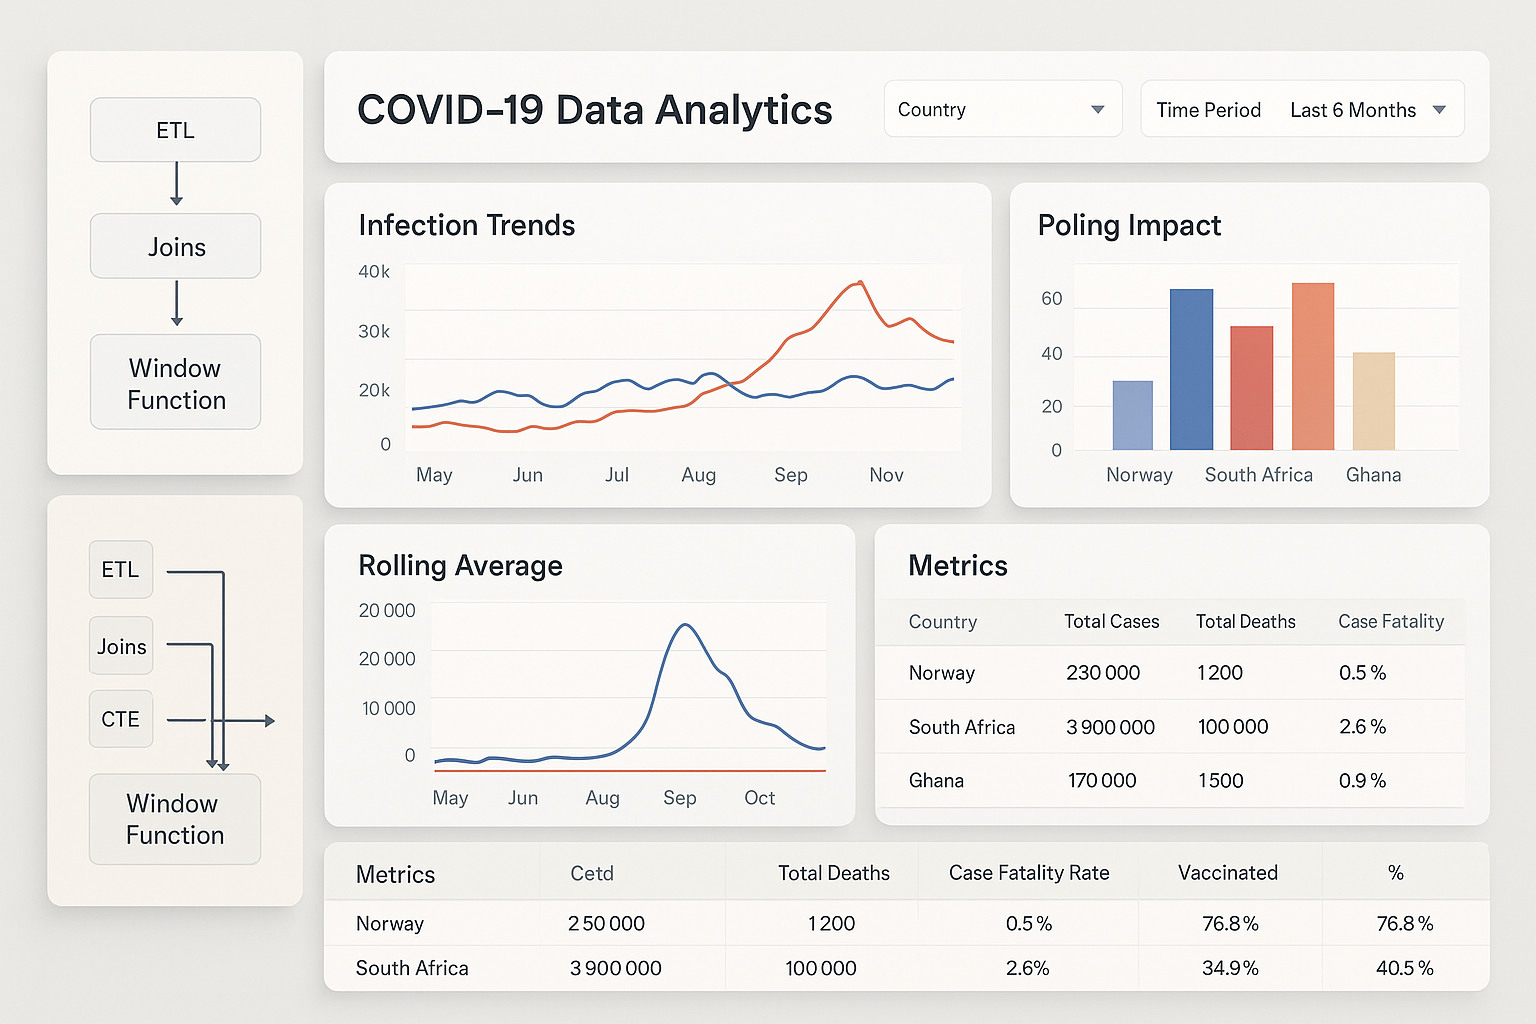
Built ETL pipelines using SQL Server to process COVID-19 datasets across Norway, South Africa, and Ghana.
Implemented data cleaning, joins, CTEs, and window functions for cross-country comparative analysis.
Created Tableau visualizations revealing infection trends and policy impact patterns.
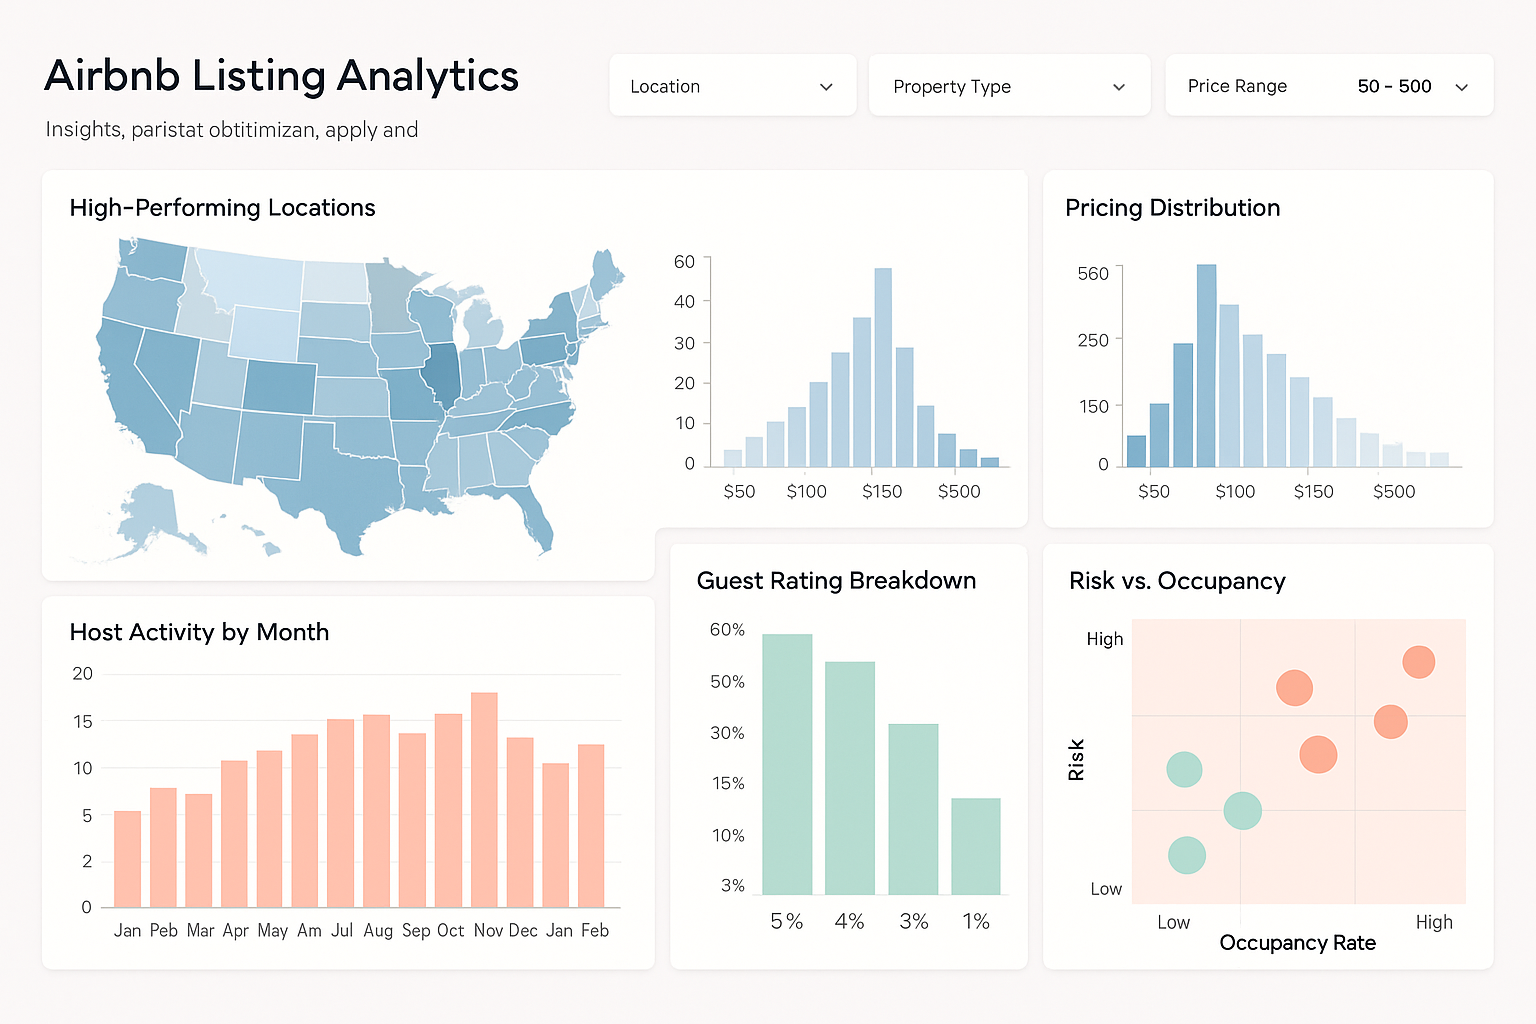
Analyzed 80+ attributes from US Airbnb listings to identify pricing optimization opportunities and market trends.
Built Tableau dashboards examining host behavior, location performance, and guest satisfaction metrics.
Delivered actionable insights on occupancy risk factors and revenue optimization strategies.
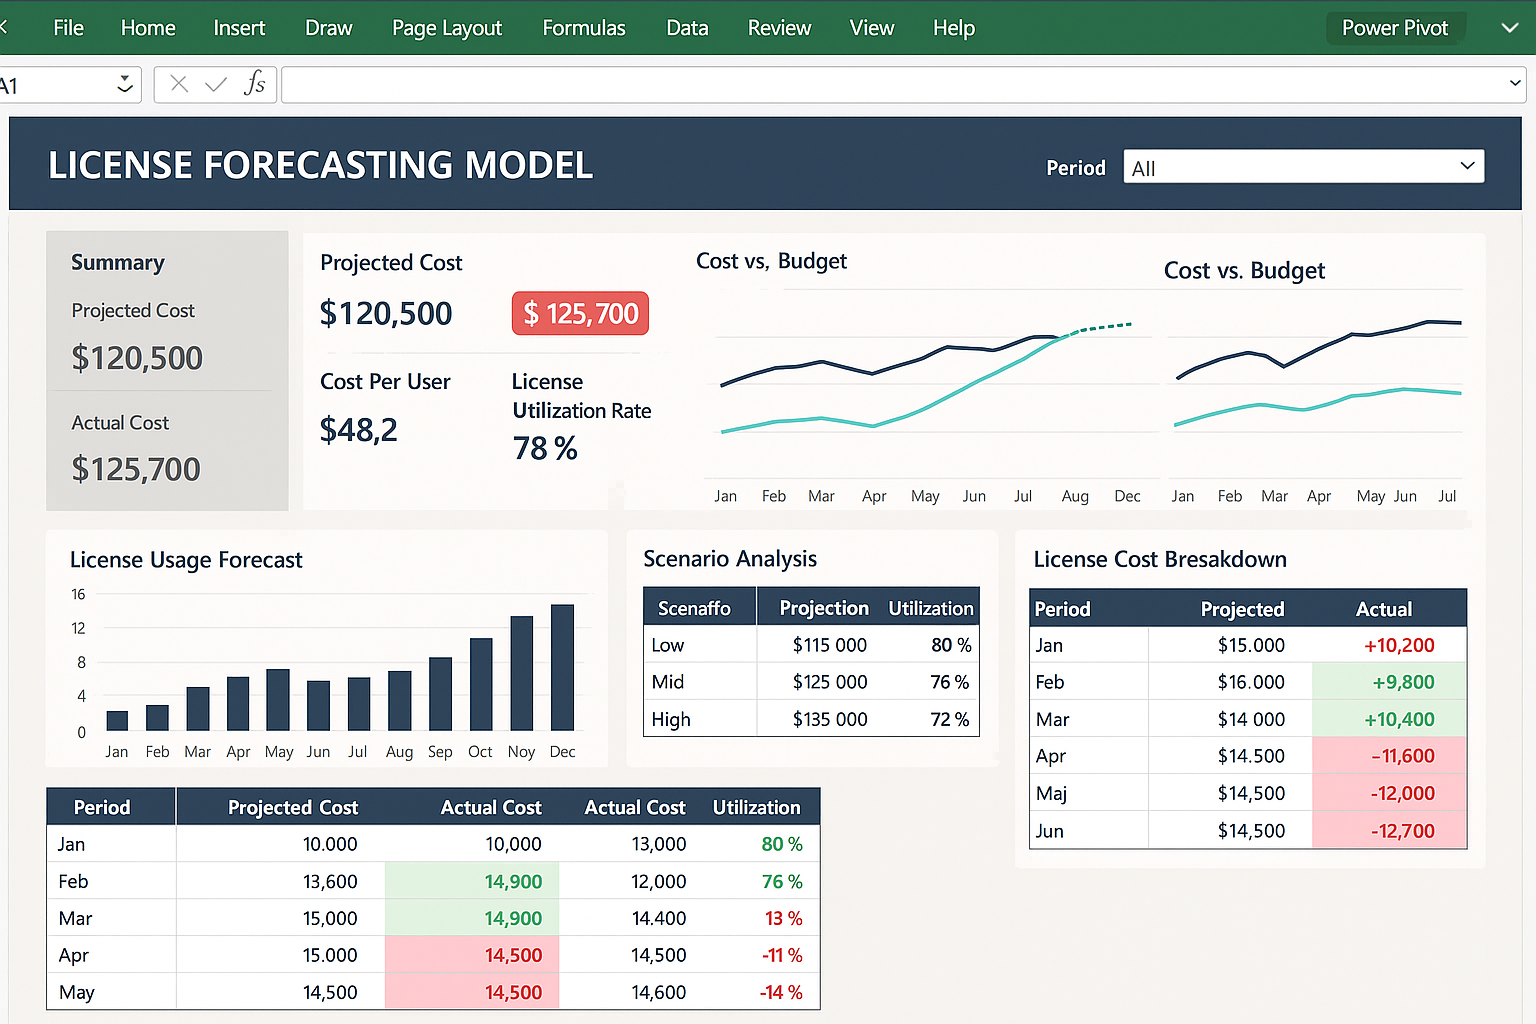
Developed dynamic Excel dashboards with Power Pivot for software license cost optimization and usage forecasting.
Automated 70% of manual reporting tasks using VBA and scenario modeling.
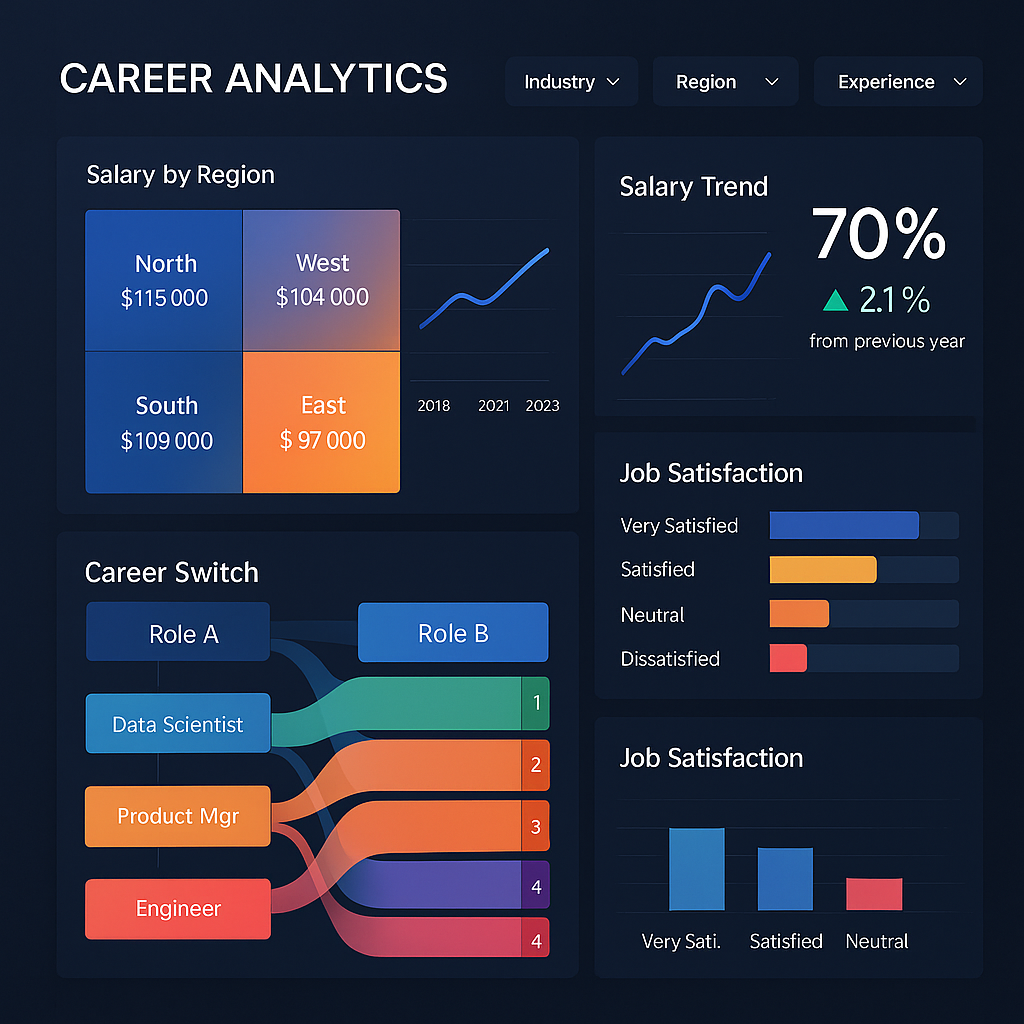
Analyzed survey data from 25+ variables covering salary trends, career mobility, and job satisfaction across tech professionals.
Built interactive Power BI dashboards with DAX calculations and custom visuals for workforce analytics. Key Insights: Identified salary gaps by region, career switch patterns, and satisfaction drivers for strategic HR decisions.
"Joshua delivered a forecasting model in Excel that cut our manual reporting time by over 70%. His Tableau dashboards helped us uncover hidden pricing trends across 80+ Airbnb variables, directly supporting our curriculum design on data storytelling. He's one of the few interns who delivered both technical precision and business relevance."
"Joshua built a full-stack CRM tracking system with React and PostgreSQL that included dynamic forecasting using Python. His Power BI dashboards visualized over 25 workforce metrics, helping our HR team prioritize hiring strategies across regions. His work brought structure and intelligence to areas we previously managed manually."
Published Research
Innovative STEAM Education & Teaching Practice
International Journal of Management Studies and Business Research (IJMSBR), Vol 10(4), 2023
Linking Science to Real Life in Basic Schools
International Journal of Management Studies and Business Research (IJMSBR), Vol 10(4), 2023
Classroom Management & Student Stress
International Journal of Management Studies and Business Research (IJMSBR), Vol 10(2), 2023